In today’s digital world, every second counts. If your system slows down or crashes, you risk losing money, trust, and users. That’s why monitoring and observability aren’t just nice to have—they’re critical. You need to know what’s happening inside your apps and infrastructure before your users do. That’s where Prometheus and Grafana come in. This powerful combo gives you full visibility into your system’s health, performance, and usage—all in real time. With Prometheus collecting detailed metrics and Grafana turning them into clear, interactive dashboards, you can spot issues early, fix them fast, and even prevent problems before they happen.
Whether you’re managing microservices, cloud-native apps, or legacy systems, these tools help you stay in control. In this blog, you’ll learn how Prometheus and Grafana work together to keep your systems reliable, efficient, and ready for anything the digital world throws your way.
Prerequisites
- Before learning Prometheus and Grafana, you need certain prerequisites to understand how these tools work and how to use them effectively. They involve working with Linux commands, networking, metrics, and YAML configurations, which are core to setting up, running, and debugging these systems. Without this foundation, you might face issues with installation, data collection, or dashboard creation. These basics make your learning smoother and help you solve real-world problems confidently using Prometheus and Grafana.
1. Basic Understanding of Linux & Command Line
- You need to know some basic Linux commands like
ls,cd,grep, andchmod. These help you move around, search files, or change permissions. You should also learn how to edit files using tools likevimornano. Also, know how to start, stop, or check services using commands likesystemctlandjournalctl. Why? Because Prometheus uses config files in Linux, and Grafana runs as a service. So, you’ll often work in the terminal to set things up or fix issues.
2. Fundamentals of Networking
- You must understand IP addresses and ports. Prometheus usually uses port 9090, and Grafana uses 3000. Learn how to work with firewalls or security groups to allow traffic between them. Also, understand HTTP and HTTPS, since both tools use these to talk to each other. If you don’t set this up right, you might get “connection refused” errors. That’s a pain! So, networking basics are super important for smooth communication between services.
3. Basics of Monitoring Concepts
- Learn what metrics are — they’re just numbers that measure things like CPU usage or website speed. Prometheus tracks these as time-series data, meaning it shows how things change over time. Also, get the difference between logs, metrics, and traces — they are called the three pillars of observability. Prometheus focuses on metrics, while other tools like ELK deal with logs. Knowing these helps you understand your system better and catch problems early.
4. Containerization & Orchestration (Optional but Helpful)
- It helps if you understand Docker — it’s a tool that runs Prometheus or Grafana in containers. Think of containers like mini-computers inside your computer. Learn Kubernetes (K8s) too — it manages lots of containers easily. Prometheus works very well with K8s. Even if it’s optional, this knowledge gives you a modern way to deploy and monitor apps. Many companies use these tools today, so knowing them gives you an edge.
5. Programming Basics (Especially YAML & Query Languages)
- You should learn YAML, a way to format text used in ‘
prometheus.yml‘ files. It looks simple but needs careful spacing. Then, there’s PromQL, which is like SQL but is used to get specific metrics from Prometheus. Also, learning a bit of scripting (Bash or Python) helps you automate tasks like setting up alerts or cleaning old data. If you know these, you can write better queries and fix errors faster.
6. Experience with Web Servers & APIs
- You need to understand how web servers like Nginx or Apache share data. They often show metrics at a /metrics URL. Prometheus goes to these links to collect data. Also, learn what a REST API is — it lets you interact with software using HTTP calls. Grafana has one, and you can use it to create dashboards automatically. This helps when you’re managing lots of systems and don’t want to do everything manually.
7. Familiarity with a Cloud Provider (AWS/GCP/Azure)
- Knowing how to use cloud platforms like AWS, GCP, or Azure is super helpful. You should learn about monitoring tools they offer, like CloudWatch in AWS. Also, you should know how to launch VMs, use load balancers, and store data in the cloud. Grafana can pull data from these cloud tools, too. So, being comfortable with the cloud helps you combine cloud and local metrics in one place.
8. Basic Knowledge of Databases
- Prometheus uses a special kind of database called a Time-Series Database (TSDB) to store metrics over time. You should understand how this works. Grafana can also pull data from SQL databases like PostgreSQL. So it helps if you know a bit of SQL to write queries and make cool dashboards. When you understand how data is stored, you can optimize what you save and how fast you get results.
9. Hands-On with Virtualization (Optional)
- Try learning tools like Vagrant or VirtualBox to create Virtual Machines (VMs) on your computer. These are like practice servers. You can install Prometheus and Grafana there and try everything without breaking your real system. It’s a safe space to experiment. This is not a must, but it’s very helpful before moving to real production servers where mistakes can cause big problems.
10. Problem-Shooting Mindset
- Finally, you need a problem-solving attitude. Be ready to fix errors like Prometheus not collecting data, Grafana showing “No Data”, or alerts not working. This happens a lot, even if everything looks okay. Learn how to read logs, check configs, and test endpoints. Basically, treat your monitoring tools like they also need monitoring. If you can think clearly and troubleshoot well, you’ll be a great monitoring engineer.
1. Monitoring vs. Observability: Understanding the Foundation
Before you start using tools like Prometheus or Grafana, you need to understand the difference between monitoring and observability.
a. Monitoring
- Monitoring means you track certain known values like CPU usage, memory, or response time. You do this to find out if something is going wrong. For example, if your website is running slow, monitoring tells you that the response time is high. It answers the question: “Is something broken?” It uses predefined metrics that you already decided were important to track. Monitoring is great for spotting known problems quickly, but it doesn’t always tell you why something went wrong.
b. Observability
- Observability goes one step further. It helps you understand why your system is having issues, not just that something is wrong. You use metrics, logs, and traces to dig deeper into the system’s behavior. It’s like being a detective who has more tools to find the exact cause of a problem. Observability lets you ask open-ended questions and find answers without needing to guess in advance what might go wrong. It answers: “Why is it broken?” This is important when new or unexpected problems show up in your system.
c. Why It Matters
- You need both monitoring and observability to keep your systems healthy. Monitoring gives you alerts when something fails. Observability helps you investigate and fix it. Prometheus helps you collect metrics (monitoring), and Grafana lets you visualize them and explore the system (observability). If you only monitor without observability, you might miss the full picture. So before diving into the tools, learn this basic difference—it’s the foundation of good system management.
2. Prometheus: The Monitoring Powerhouse
a. What is Prometheus?
- Prometheus is an open-source monitoring tool that helps you track the performance of systems, servers, or applications. It was first created by SoundCloud and is now part of the CNCF (Cloud Native Computing Foundation). You use Prometheus to collect time-series data, which means data that changes over time—like CPU usage every second. It’s built to be fast, reliable, and able to scale easily as your systems grow. You’ll like Prometheus because it helps you analyze data in real time, find problems quickly, and keep your system running smoothly without guesswork.
b. Key Features
1. Multi-Dimensional Data Model
- In Prometheus, every metric you track has a name and extra details called labels (like
status="500"orjob="login"). These labels let you filter, group, and analyze data more deeply. It’s like organizing notes by subject so you can find what you need fast. You don’t just see how many requests happened—you see how many failed, which service caused them, and more. That gives you way more control and insight.
2. PromQL (Prometheus Query Language)
- PromQL is the language you use to ask questions about your data. You write PromQL queries to check performance, find problems, and build alerts when something’s wrong. It’s similar to SQL but made for time-based data like CPU usage over time. You can even calculate trends or compare services. Once you learn PromQL, you can slice and dice your data in smart ways and see exactly what’s going on inside your system.
3. Pull-Based Architecture
- Prometheus doesn’t wait for data—it goes out and pulls data from apps or servers using HTTP. This method is called a pull model, and it’s easier to manage when working with firewalls or private networks because you control what gets pulled and when. You don’t need to set up each server to send data—you just point Prometheus to it. It’s simple, and you get consistent and secure data all the time.
4. Alertmanager
- The Alertmanager works with Prometheus to help you handle alerts. It listens for alerts from your PromQL queries and decides what to do next. If the same issue comes up multiple times, you can group or mute them. You can also send alerts to tools you already use like Slack, PagerDuty, or email. That way, you don’t miss anything important, and you won’t be overwhelmed with repeated messages about the same problem.
5. Exporters and Integrations
- Exporters are little programs that collect data from your systems and send it to Prometheus. You’ll use exporters like Node Exporter to get server stats or Blackbox Exporter to check if a website is working. Prometheus has tons of integrations for things like databases, Docker, and hardware. That means you can monitor almost anything with the right exporter, making it a flexible and powerful system for all kinds of environments.
6. Time-Series Database (TSDB)
- Prometheus stores all your data in its own time-series database. That means you don’t need another database to keep track of your metrics. The TSDB stores values with timestamps so you can easily track changes over time. You’ll use this to visualize trends, understand patterns, and figure out when something went wrong. Because it’s built in, it works fast and doesn’t need extra setup. It’s perfect for real-time analysis.
7. Service Discovery
- Prometheus can automatically find and monitor services running in environments like Kubernetes, AWS EC2, or Consul. This is called service discovery. Instead of manually adding every new server or app, Prometheus will find them for you. This saves you time and helps your setup stay up to date. It’s especially useful in dynamic cloud environments, where services often come and go. You get continuous, hands-free monitoring without much extra work.
8. Data Retention Policies
- Prometheus lets you choose how long to store data using retention settings. You can keep only a few days’ worth of data to save space or keep months of data to analyze long-term trends. This is useful for managing storage size and system performance. You’ll set these rules based on your needs. If you don’t need old data, you can clear it out automatically. It’s a smart way to balance cost and visibility.
9. Easy Visualization with Grafana
- Prometheus has a basic web interface, but when you link it to Grafana, you get beautiful, real-time dashboards. Grafana lets you create graphs, charts, and panels with your Prometheus data. You can see CPU usage, errors, or memory trends in a visual way, which makes it easier to spot problems. You’ll love how Grafana helps you understand data at a glance, even if you’re not super technical. It’s a great tool for teams, too.
10. Lightweight and Fast
- Prometheus is very lightweight, so you can run it even on a small server or laptop. It doesn’t use a lot of memory or CPU, but it still collects and stores a lot of data. It’s made to be fast and efficient, which makes it perfect for both small projects and big systems. You don’t need powerful hardware to start using it. You’ll find it easy to install, run, and scale as needed.
11. Community and Documentation
- Prometheus has a big open-source community, which means you can find lots of help online. There are guides, blogs, videos, and forums to help you when you’re stuck. The official documentation is also very detailed and easy to follow. If you’re new, you’ll find examples to get started fast. And if you run into issues, the community is always improving Prometheus and adding features. You’re never really alone with this tool.
12. Custom Metrics Support
- You can use Prometheus to track your own data, not just system stuff. With custom metrics, you add tracking to your app using libraries in Go, Python, Java, or other languages. This helps you monitor things like user logins, signups, or failed payments. These custom metrics are perfect when you need to know exactly how your application is behaving. It gives you complete control over what you see and how you monitor it.
c. Architecture Overview
1. Targets
- In Prometheus, the targets are the apps, servers, or services you want to monitor. Each target exposes metrics through a special HTTP endpoint (usually something like
/metrics). You don’t need to install Prometheus inside the app—just make sure the app gives out metric data in the right format. When Prometheus visits that endpoint, it can see all the stats your app is sharing, like memory usage or request speed. You just need to point Prometheus to the right target, and it starts collecting the data for you.
2. Scraping
- Prometheus uses a method called scraping to pull data from targets. You decide how often it checks for data—maybe every 15 or 30 seconds. Prometheus will visit each target’s metrics endpoint and grab the latest numbers. This is better than waiting for data to be pushed in because it gives you more control and is easier to manage in firewalled networks. You don’t need to set up sending on each server—Prometheus does the pulling. This scraping process builds the time-series data for which Prometheus is known.
3. Storage
- After scraping metrics, Prometheus saves the data in its own Time-Series Database (TSDB). Each piece of data has a timestamp, so you can track how values change over time. It stores data locally by default, but if you need more space or want to back up data, you can use remote storage options. This setup is perfect for both short-term troubleshooting and long-term analysis. With time-series storage, you can build graphs, spot trends, and understand how your system behaves at different points in time.
4. Alerting
- Prometheus lets you create alerting rules using its query language, PromQL. You write conditions like “if CPU usage is over 90% for 5 minutes”, and Prometheus watches for it. When a rule is triggered, it sends the alert to the Alertmanager. The Alertmanager decides who gets notified, how often, and where—like through Slack, email, or other tools. You can also group, mute, or delay alerts. This keeps your team informed without overwhelming them, so you can fix issues fast and stay in control.
d. Example Use Case: Monitoring a Kubernetes Cluster
- Imagine you’re running a Kubernetes cluster, which means you have many small apps called pods working together. You use Prometheus to keep an eye on the health of those pods. Prometheus scrapes metrics like CPU usage, memory usage, and the number of HTTP errors. These metrics help you spot problems—like if a pod is using too much memory or keeps failing. You don’t have to check everything yourself. Prometheus collects data automatically, and you can set alerts to warn you when something’s wrong so your system stays stable and reliable.
3. Grafana: The Visualization Virtuoso
a. What is Grafana?
- Grafana is an open-source tool that helps you visualize data in a way that’s easy to understand. Instead of just looking at raw numbers, you can turn them into colorful dashboards, graphs, and charts. Grafana works with many data sources like Prometheus, Elasticsearch, and InfluxDB. So when Prometheus collects system data, Grafana lets you see it clearly—like tracking CPU usage or errors over time. You can interact with the dashboards, set filters, and even create alerts. It’s perfect for spotting trends and fixing problems fast by making your system’s data easy to read and act on.
b. Key Features
1. Role-Based Access Control (RBAC):
- In Grafana, you use Role-Based Access Control (RBAC) to decide who can do what inside the platform. You assign roles like Admin, Editor, or Viewer to each user. If you’re an Admin, you can change everything. An Editor can make or change dashboards but not user settings. A Viewer can only see dashboards without changing anything. This helps keep things organized and secure. You don’t want just anyone messing up your work. With RBAC, you make sure the right people have the right access, which is super useful when working in teams or organizations.
2. Dynamic Dashboards
- With Grafana, you can create dynamic dashboards that show real-time data using graphs, gauges, and heatmaps. You don’t need to code—just use the drag-and-drop interface to build panels. For example, you can make a graph that shows CPU usage or website traffic over time. Everything updates live, so you always see the latest data. This helps you understand what’s happening in your system at a glance. The best part is that you can move things around and customize everything the way you like it.
3. Templating
- Templating lets you build dashboards that are reusable and flexible. You can add variables like ‘
environment=prod'or ‘region=us-west‘, so instead of making new dashboards for each case, you just switch the values. It’s like using one dashboard for many systems. This saves you time and helps you focus only on what you want to see. For example, if you’re checking the status of different servers, you can use a drop-down menu to filter the data with just one click. It makes your dashboards smarter and easier to use.
4. Annotations
- Annotations let you mark special events directly on your graphs. For example, if you do a deployment or a server restart, you can add a note on the chart at that exact time. Later, when you see a spike or error, you’ll know if it was related to that change. It helps you connect what happened in your system with why your metrics changed. This makes it easier to debug problems and understand the timeline of events. You can add annotations manually or use tools that add them automatically.
5. Alerts
- With alerts, you can tell Grafana to watch your data and notify you when something goes wrong. You set thresholds, like “alert me if CPU usage goes above 90%.” Grafana checks the data and sends alerts through email, Slack, or even PagerDuty. This means you don’t have to stare at dashboards all the time. Grafana does the watching for you and warns you before a problem gets big. It helps you fix issues quickly and keeps your system running smoothly, even if you’re not constantly checking it.
6. Plugins
- Plugins give Grafana extra power. You can install plugins to add new data sources, visual panels, or even apps. For example, if you want to show fancy charts or pull data from a special database, there’s probably a plugin for it. This makes Grafana very customizable. You can turn it into the perfect tool for your team. Installing a plugin is easy, and there’s a huge library to choose from. You’re not stuck with the default setup—you can always expand what Grafana can do.
7. Dashboard Version Control
- In Grafana, you get dashboard version control, which means it keeps track of every change you or someone else makes to a dashboard. If someone messes something up or deletes a panel by mistake, you don’t have to worry. You can roll back to an earlier version with just a click. This is super helpful when multiple people are editing the same dashboard. It’s like having a backup for your visuals. You stay in control and never lose important settings, so your monitoring stays clean and reliable.
8. Built-In User Authentication:
- In Grafana, you get built-in user authentication, which means only the right people can log in and use it. You can set up a secure login using systems like OAuth, LDAP, or SAML. These are like digital gatekeepers that check who you are before letting you in. If you’re working in a team or a company, this keeps your dashboards safe from outsiders. You don’t have to worry about unauthorized access. You also get to control what each user can do—some can just view, and others can edit. It makes your Grafana setup secure and organized.
9. Data Source Flexibility:
- In Grafana, you can connect to many data sources at the same time. This is called data source flexibility. You can pull information from Prometheus for metrics, Loki for logs, or even databases like MySQL and cloud tools like AWS CloudWatch—all in one dashboard. This means you don’t need different tools for different data. You just plug them into Grafana and see everything in one place. It makes your work easier because you can compare and visualize data from different systems together. It’s super helpful for monitoring, troubleshooting, and decision-making.
10. Provisioning:
- In Grafana, you can use provisioning to automatically set up your dashboards, data sources, and users. Instead of clicking around the interface every time, you just write a few settings in a YAML or JSON file. When Grafana starts, it reads the file and builds everything for you. This saves a lot of time, especially if you’re setting up the same stuff on multiple servers. It’s also great for automation, so you don’t have to repeat tasks. You make a change once, and it’s applied everywhere. That’s smart, fast, and super helpful when working in DevOps or large teams.
c. Architecture Overview
1. Data Sources:
- You can connect Grafana to different data sources like Prometheus, databases (MySQL, PostgreSQL), or even cloud services like AWS or Google Cloud. This means Grafana doesn’t store the data—it just reads it from wherever it’s already saved. You choose where your data comes from, and Grafana will help you visualize it. You can even combine data from different sources into a single dashboard. This flexibility makes it easy for you to track everything from server health to business stats using one tool.
2. Dashboards:
- Grafana lets you create dashboards where you can see your system’s data using cool visual tools like graphs, gauges, and charts. You can add panels to show different types of information, like CPU usage or error rates. Everything is customizable, so you can move things around and design it the way you like. It’s super helpful when you want a clear view of what’s going on. With dashboards, you don’t just see numbers—you see patterns, trends, and problems at a glance.
3. Alerting:
- With Grafana, you can set up alerting rules that watch your data for specific conditions. For example, if your server’s CPU usage goes above 90%, Grafana can send you a notification. You can also use Prometheus’ Alertmanager to manage alerts better—like grouping them or sending them to Slack, email, or other tools. This means you won’t miss critical issues because Grafana will tell you the moment something goes wrong. It helps you stay on top of problems before they get worse.
4. Cloud-Native Support:
- Grafana supports all the big cloud providers like AWS, Azure, Google Cloud, and even Kubernetes. It connects easily with their monitoring tools like CloudWatch or GCP Monitoring. This means you can visualize and alert on your cloud systems without needing extra tools. If you’re working on cloud apps, this makes your life easier. You can track servers, containers, and cloud services all from one Grafana dashboard. It’s designed to fit perfectly in modern cloud-native environments.
5. Loki Integration:
- Grafana works with Loki, which is a log aggregation system made by the same team. While Prometheus gives you metrics like CPU usage, Loki shows you logs from your apps. When you combine both, you get a full view of what’s happening. For example, you see an alert from Prometheus and then check the logs in Loki to find out what went wrong. Grafana makes it easy to switch between graphs and logs in one place.
6. API Access:
- Grafana provides an HTTP API, which is like a remote control for developers. You can use it to automate things like creating dashboards, adding users, or setting up data sources without doing it manually on the screen. If you’re building a big system or using scripts to save time, this feature is super helpful. You don’t have to click buttons—just run your code, and Grafana does the work. It’s great when you want to manage Grafana with other DevOps tools.
d. Example Use Case:
- Imagine you’re on a DevOps team, and your job is to keep many microservices running smoothly. You want to know which parts of your system are slow. With Grafana, you can create dashboards that show API latency—how long it takes your services to respond. You can easily spot slow endpoints, like maybe the login or payment service is lagging. Grafana shows this visually, so you don’t need to dig through logs. You just look at the dashboard and take action. This helps you fix issues faster and keep users happy.
4. Synergy in Action: How Prometheus and Grafana Work Together
Prometheus excels at collecting and storing metrics, while Grafana turns them into insights. Here’s how they integrate:
1. Data Collection
- You use Prometheus to collect metrics by making it scrape data from different systems or services, like your apps, servers, or databases. It does this by visiting endpoints and pulling data at regular intervals. You don’t need to push anything manually—Prometheus handles that for you. This makes sure you always have fresh and up-to-date data from all your targets.
2. Storage
- Once Prometheus collects your data, it stores everything in its own Time Series Database (TSDB). This database is made for handling time-based data, like CPU usage every 5 seconds. It keeps the data organized by timestamp and labels, so you can go back and check how things looked before. You get both short-term visibility and the ability to look at historical trends.
3. Visualization
- Grafana doesn’t store data itself—it connects to Prometheus using a data source plugin. You write queries in PromQL or use Grafana’s visual tools to pull the data you need. Then, Grafana turns this data into graphs, charts, and dashboards. It helps you understand the data better so you can spot problems fast or make better decisions based on what you see.
4. Alerting
- You can use Prometheus Alertmanager to send alerts when something’s wrong—like when memory is too high or a server goes offline. Grafana also has built-in alerting so you can set alert rules right from your dashboards. You get notified by email, Slack, or other tools. This helps you fix problems quickly before they become bigger issues.
Step-by-Step Example: Monitoring a Web Server
1. Set Up Prometheus
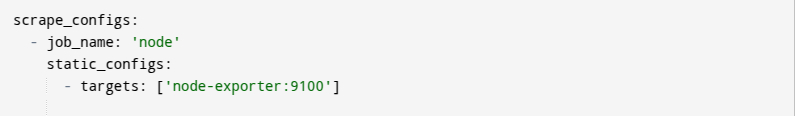
- First, you configure Prometheus to collect data from your web server. You edit a file called
prometheus.ymland tell it to scrape metrics from Node Exporter. Node Exporter gives info like CPU usage and memory stats. You add a job name"node"and set the target address, such as'node-exporter:9100'. This setup lets Prometheus automatically pull important server metrics every few seconds. It’s like telling Prometheus where to look and what to collect for your system’s health.
2. Create Grafana Dashboard
- After Prometheus is running, you connect it to Grafana. Inside Grafana, you go to “Data Sources” and add Prometheus. Then, you build a custom dashboard. You drag and drop panels to display things like CPU usage, memory consumption, and request rates. You can customize each panel to show graphs or gauges with specific styles or time ranges. This dashboard gives you a visual view of server performance, making it easier to understand how your server behaves over time.
3. Set Alerts in Prometheus
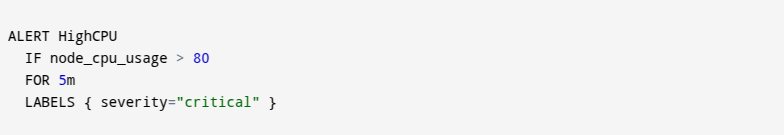
- You can set alerts in Prometheus to warn you when something goes wrong. For example, you create a rule in YAML format
ALERT HighCPUthat checks if CPU usage goes over 80% for 5 minutes straight. You add labels"severity=critical"to show how serious the issue is. Prometheus will then trigger this alert and send it through tools like Alertmanager, email, or Slack. This helps you fix problems quickly without staring at graphs all day.
4. Set Alerts in Grafana
- Grafana also lets you set alert rules right inside your dashboards. For example, you can create an alert that triggers when HTTP error rates go above 5%. You just pick the panel, define the alert condition, and choose how you want to be notified—email, Slack, or other services. Grafana checks the data regularly and notifies you automatically. This makes sure you don’t miss any problems, even if you’re not watching the dashboard all the time.
5. Benefits of Prometheus and Grafana
a. Real-Time Insights
- You get real-time monitoring, which means you can see what’s happening in your system as it happens. If there’s a memory leak, a CPU spike, or a sudden traffic burst, you’ll notice it right away. Prometheus collects data every few seconds, and Grafana shows it instantly on your dashboard. You don’t have to wait until something breaks or someone reports it. You can act immediately, fix issues fast, and keep your system healthy without delays. That’s how real-time visibility gives you quick control and peace of mind.
b. Root Cause Analysis
- With PromQL, you can filter metrics and look deeper into your data. For example, if your website is running slow, you can check which service or endpoint is the problem. Maybe it’s only the login feature or only happening in production and not in testing. These labels and queries help you understand exactly where and why something is broken. You don’t have to guess. You find the root cause faster and fix it smarter. It saves time and helps you prevent the issue from happening again.
c. Proactive Optimization
- You don’t have to wait for problems to occur. You can analyze your metrics and make improvements ahead of time. Maybe some servers are barely being used, and you’re paying for them unnecessarily. Prometheus shows you what’s running, and Grafana helps you spot unused resources easily. You can reduce your server count, save money, and make your system more efficient. This is called proactive optimization, where you make smart changes before things go wrong instead of after. It’s all about being one step ahead.
d. Unified View
- Using Grafana, you can connect many data sources like Prometheus, AWS CloudWatch, Elasticsearch, or Google Cloud and bring them into one place. You don’t have to log into different dashboards or tools to check performance. With a unified view, you can see everything in one dashboard—all the metrics, alerts, and logs together. This makes your job easier and saves you time. You get the full picture of your system’s health at a glance, no matter how big or complex it is.
e. Custom Dashboards
- Grafana lets you design custom dashboards just the way you like. With the drag-and-drop feature, you can easily add graphs, gauges, heatmaps, or tables to your dashboard. It’s up to you to decide what to monitor, how it should look, and even which colors or styles to use. Different teams, like DevOps or developers, can have their own dashboards customized to their specific needs. These dashboards make it easy for you to focus on what matters most. You’re not stuck with a one-size-fits-all view—you make it your own. This helps you understand your system faster and communicate data more clearly.
f. Alerts and Notifications
- You don’t have to stare at dashboards all day. With alerts, you can set rules for when something goes wrong—like high memory usage or too many errors. Prometheus or Grafana will send notifications via email, Slack, or even text. This way, you’ll know the moment something breaks, even if you’re not at your desk. You can respond quickly and fix it before it becomes a big issue. Alerting helps you stay in control and reduce downtime.
g. Historical Analysis
- Prometheus stores time-series data, which means you can look back at how your system behaved in the past. Grafana makes it easy to view and compare this data across days, weeks, or even months. You can identify trends, like whether traffic is rising every Friday or if performance dropped after a new update. This helps you make smarter decisions and find recurring issues. You can also track improvements after making changes. With historical analysis, you don’t just guess—you use facts to learn and improve.
h. Scalability
- As your system grows, Prometheus and Grafana can handle it. You can monitor thousands of targets, collect millions of data points, and still keep your dashboards running smoothly. You don’t need to change tools when your app becomes more popular or your infrastructure expands. Grafana supports many data sources, and Prometheus works well in distributed environments like Kubernetes. Both tools are built to grow with you, making them perfect for both small startups and large enterprises. That’s why they’re trusted by companies around the world.
i. Case Study
- You work at a fintech company that provides financial services through an app. Users complain that the app feels slow. So, you use Grafana dashboards to watch how your system is running. You spot a problem—API latency is high. Digging deeper, you find it’s caused by some slow database queries. With that info, your team fixes the queries, and suddenly, the API latency drops by 40%. That means your app responds much faster. This case shows how Grafana helps you find and fix performance issues, making your system faster and your users happier.
6. Use Cases Across Industries
a. Microservices
- When you deal with microservices, many small parts of your app talk to each other. With Prometheus, you track things like latency, error rates, and response time for each one. Grafana then shows this data on dashboards so you can see which part is slow or failing. This makes it easier for you to find the problem quickly and fix it before it affects your users. It helps you maintain smooth communication between services, which is super important in complex systems.
b. DevOps
- In your DevOps role, you’re in charge of making sure apps are built, tested, and deployed smoothly. With Prometheus, you track each step in your CI/CD pipeline—from code pushes to deployment. If something breaks or slows down, you’ll see it right away. Grafana gives you clear visuals that show how every change affects the system. If a new release creates errors, you’ll know immediately and can roll back or fix it fast. This makes deployments safer and more reliable.
c. Cloud-Native
- If you’re working with cloud-native apps, like those running on Kubernetes, you need to keep track of things like pod health, CPU usage, and memory limits. Prometheus collects this data, and Grafana displays it in dashboards. This helps you see how well your apps are using cloud resources. If something is using too much or too little, you can change the settings and save money. You can also make sure your app doesn’t crash because of too few resources.
d. IoT
- In an IoT setup, you might manage thousands of devices like sensors or smart gadgets. These devices send a lot of data, like battery life, temperature, or connectivity status. Prometheus collects all this, and Grafana shows it in charts. This lets you watch how your devices are performing. If one device acts weird or drops offline, you’ll know fast. You can fix issues early before they turn into big problems, which is super useful in large-scale systems.
e. E-Commerce
- Running an e-commerce site? Prometheus helps you track things like page speed, cart success rates, and server health. Then Grafana shows you easy-to-read dashboards so you can see if your site slows down during a sale or crashes when too many people visit. You use this data to keep the shopping experience smooth. If customers face delays, you can fix them quickly and stop losing sales. It helps you provide a better customer experience and improve your sales.
f. Healthcare
- In healthcare, your systems deal with sensitive and critical data. You can use Prometheus to monitor system uptime, data processing, and application errors. Grafana gives you real-time dashboards so you can catch issues before they affect patient care. You can even set alerts so that if something breaks, you’re notified immediately. This helps you maintain patient safety and follow strict compliance rules. In this field, avoiding downtime isn’t just good—it’s necessary.
g. Education Platforms
- If you manage an online learning platform, you want to make sure videos play smoothly, classes load fast, and students don’t face tech issues. Prometheus tracks user activity, video load times, and system status. Grafana shows it all on dashboards. If there’s a problem, you can fix it fast. This makes sure both teachers and students have a great experience. Good performance means more users stay happy and engaged with your platform.
h. Finance & Banking
- In banking, everything has to be fast, accurate, and secure. Prometheus can track API latency, failed transactions, and server health. Grafana lets you see it all clearly, in real time. If something goes wrong—like slow service or transaction errors—you’ll get alerts and can act fast. This helps you protect customer data and build trust. It’s especially important in finance, where even small issues can cost a lot or lead to serious consequences.
7. Challenges and Best Practices
a. Challenges:
1. Prometheus Scaling
- When your system grows, Prometheus alone might struggle with too much data. You can use tools like Thanos or Cortex to scale Prometheus, add long-term storage, and support federation (collecting data from multiple Prometheus servers). These tools help you keep your monitoring fast and reliable, even in large environments.
2. Metric Overload
- Collecting too many metrics can make things confusing and slow. Focus on important metrics like SLOs (Service Level Objectives)—for example, uptime, latency, or error rate. This helps you stay focused on what matters instead of drowning in unnecessary numbers.
3. Grafana Complexity
- Grafana has a lot of features, which might feel overwhelming at first. A good tip is to start simple, using prebuilt dashboards from Grafana Labs. These ready-made templates help you learn quickly and let you see real results without setting up everything from scratch.
4. Alert Fatigue
- If you create too many alerts, you might start ignoring them. This is called alert fatigue. To avoid this, set alerts only for critical issues and use thresholds wisely. Combine alerts with labels to group them by service or severity for better clarity.
5. Data Retention
- By default, Prometheus keeps data for only 15 days. If you want to keep historical data longer, use remote storage integrations or tools like Thanos. This helps you do trend analysis and compare performance over weeks or months.
6. Query Optimization
- Sometimes your PromQL queries can get slow or complex. Learn to write efficient queries by using the right labels, avoiding wildcards, and limiting the time range. This keeps your dashboards fast and responsive.
b. Best Practices:
1. Label Thoughtfully
- When you add labels to your metrics, make sure they’re useful but not too detailed. Avoid high-cardinality labels like unique user IDs or timestamps because they create too many combinations and slow things down. Instead, use labels like region, service, or status that help filter and group your data without overloading your system.
2. Organize Dashboards
- To keep things clean and easy to use, build separate dashboards for different teams or purposes. For example, one for infrastructure health, one for application performance, and another for business KPIs like user signups or revenue. This helps each team find the data they care about without digging through clutter.
3. Test Alerts
- Before you rely on alerts in production, test them first. Make sure the conditions make sense, and when they are triggered, they give you clear, actionable messages. You don’t want alerts that are too noisy or false alarms—they just cause alert fatigue. Only set alerts that really matter and help you fix problems fast.
4. Clean Up Old Metrics
- Over time, unused or outdated metrics can slow down your system. Set retention policies or regularly audit your metrics to remove junk data. This keeps your monitoring setup fast and efficient.
8. The Future of Observability
- In the future, as systems get more complex, you’ll need even smarter monitoring tools. Prometheus and Grafana are already powerful, but they’ll keep getting better. You’ll see features like AI-powered anomaly detection, which means the system can warn you about problems even before they happen. There will also be tighter cloud integration, so monitoring your AWS, Azure, or Google Cloud services will become easier. The focus will shift toward predictive analytics—instead of just fixing issues, you’ll actually prevent them. This means your systems will be more reliable, and you’ll spend less time putting out fires.
Conclusion
- By using Prometheus and Grafana, you build a strong base for monitoring and observability. These tools help you turn raw numbers into actionable insights, so you’re not just guessing—you’re making smart decisions based on real data.
- Whether you’re managing microservices, running apps in the cloud, or keeping an eye on IoT devices, this combo helps you reduce downtime, boost performance, and create smoother user experiences. You don’t need to go big right away. Just start small—maybe monitor one web server or application—and watch how quickly you see results. As you grow more confident, you can track more systems, set up alerts, and build amazing dashboards. With Prometheus and Grafana in your toolkit, you’re always a step ahead of problems. So, why wait? Take that first step today—your systems, your team, and your users will thank you for it.